Device Usage Trends and Their Link to Success Metrics in Chance Reward Platforms
Device usage patterns in chance reward platforms continue to evolve as participants interact with prize draw systems through smartphones, tablets, and desktop computers, and researchers track how these choices align with measurable outcomes such as entry completion rates, repeat participation figures, and notification response times. Data collected through platform analytics in early 2026 shows mobile devices accounting for the majority of initial registrations while desktop sessions often record longer dwell periods during form submissions.
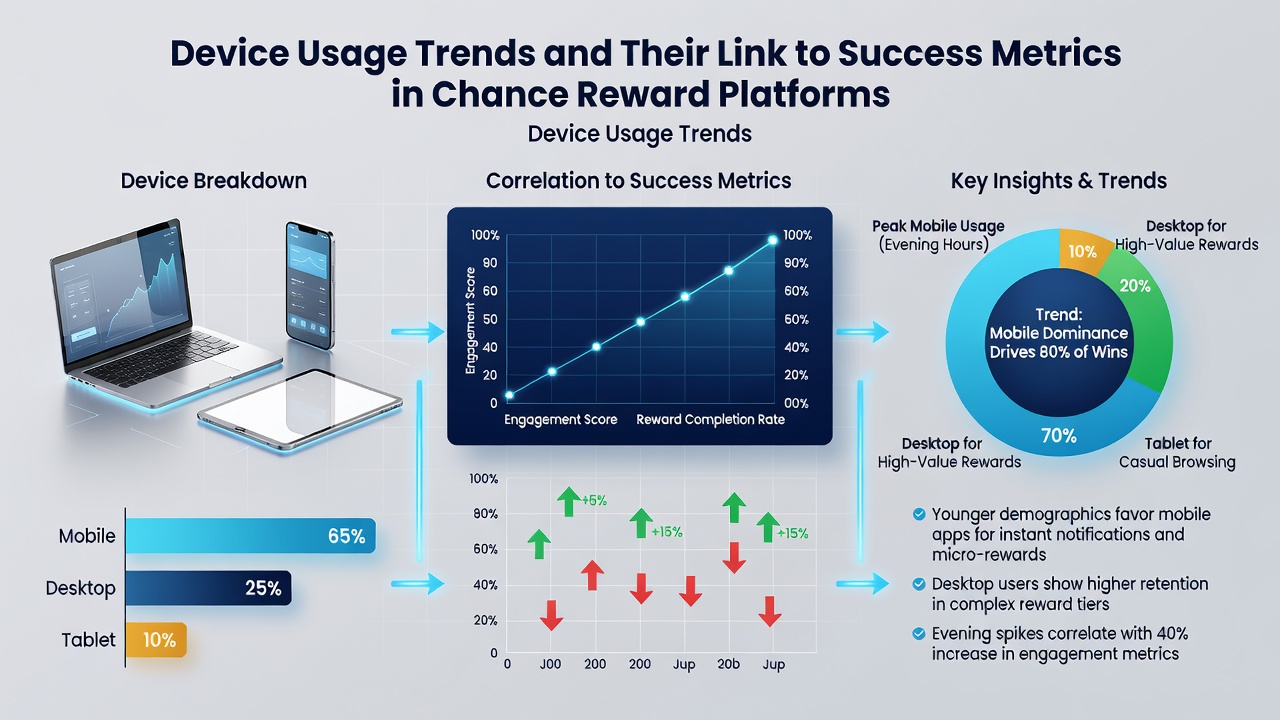
Current Device Distribution Across Platforms
Figures from mid-2026 indicate that smartphone access drives over sixty percent of daily entries on recurring prize sites, whereas desktop usage remains steady at around thirty percent and tablets fill the remaining share. Observers note that these proportions shift seasonally, with mobile traffic rising during summer months when users engage while traveling or during short breaks. Platform operators report that mobile-first interfaces support quicker form fills, yet desktop environments sometimes yield higher completion percentages when users handle multi-step verifications that require document uploads.
Linking Device Choice to Entry and Retention Metrics
Studies conducted by academic teams at several universities reveal connections between device type and success indicators such as the percentage of started entries that reach final submission. Mobile users demonstrate faster initial clicks on promotional banners, but they also exhibit higher abandonment rates when network interruptions occur during identity checks. Desktop participants, by comparison, maintain steadier progress through longer sequences, which contributes to elevated retention numbers across multi-week campaigns. Industry reports compiled by data analytics groups confirm that push notification open rates climb when users receive alerts on mobile devices, yet email follow-ups generate stronger click-throughs among those who began sessions on desktop machines.
Regional and Demographic Variations in Device Behavior
Analyses of international promotion data highlight differences across regions, with participants in North American markets showing higher tablet engagement during evening hours compared to users in European and Asia-Pacific territories who favor smartphones throughout the day. Age-related patterns appear consistently in aggregated logs, where younger cohorts complete entries predominantly via mobile while older groups split time more evenly between phones and computers. Research indicates that these habits influence overall success metrics because mobile sessions often coincide with higher volumes of social sharing that extend campaign reach without additional platform investment.
Impact of Operating Systems and App versus Browser Access
Platform telemetry from June 2026 demonstrates that entries initiated through dedicated mobile applications record slightly higher verification success compared to browser-based mobile sessions, partly because apps maintain persistent login states across multiple draws. Desktop browsers continue to support advanced features such as larger preview windows for rules and prize descriptions, which some operators link to reduced support ticket volumes. Cross-device switching occurs regularly, with users beginning an entry on one device and finishing on another, and analytics teams note that these transitions correlate with improved long-term engagement when platforms preserve session data seamlessly.
Measurement Approaches and Data Sources
According to Pew Research Center reports on device ownership and usage, smartphone penetration in the United States reached levels that mirror the mobile dominance observed in chance reward environments. Separate findings from the Australian Communications and Media Authority document similar patterns in Oceania, where mobile data consumption supports frequent interactions with online promotions. These sources provide baseline context that platform operators combine with internal metrics to refine interface designs and notification schedules.
Future Tracking Considerations
Continued monitoring of device trends will rely on refined attribution models that distinguish between primary access points and secondary touchpoints. Aggregated datasets from multiple platforms allow researchers to compare success metrics across device categories without exposing individual participant details, and such methods support ongoing adjustments to entry flows that accommodate varied hardware capabilities.
Conclusion
Device usage trends in chance reward platforms connect directly to performance indicators through measurable patterns in entry initiation, completion, and follow-up actions. Data gathered through 2026 continues to inform how operators structure interfaces and timing strategies to align with observed participant behaviors across mobile, desktop, and tablet environments.